Tag Archives: antarctica

6 Comments

In a previous post I showed the temperature cycle on the Antarctic Peninsula, and pointed out that the monthly mean atmospheric temperatures show that it is actually surprisingly moderate.  Whether you consider the temperature cycle moderate or not, the cold temperatures and strong winds drive an amazing amount of seasonal sea ice production.

This plot shows the average seasonal cycle of Antarctic sea ice extent against date.

Seasonal cycle of Antarctic sea ice extent

The daily average extent is calculated from the satellite record from 1981-2010, and the grey shading either side of the line is the standard deviation.

Here are three obvious things to pick out of this plot.

  • Antarctic Sea Ice extent varies a lot: From 2.9x10⁶ km2 in February to 18.6 x10⁶ km2 in September. This is a range of 15.7 x10⁶ km2.
  • The seasonal cycle is not symmetrical: There is a slow growth followed by a relatively rapid decay.

To really get an idea of what this asymmetric growth / decay pattern looks like watch the following you tube clip a few times. (The data for the movie is from the AMSR-E Satellite and it is from Climate Central.

So slow growth, and then rapid retreat. Ice tends to advance away from the continent, but as it retreats it can melt first within south of what you would consider the ice edge.

How the Antarctic sea ice extent is changing is for a future post, but it is currently increasing. There are significant regional changes over the duration of our satellite record. For a couple of good accesible comments on the trends in Antarctic sea extent you could read Professor John Turner in the Guardian, or Tamino on the Antarctic Sea Ice increase.

Data source

The average sea ice extent is part of the National Snow and Ice Data Center (NSIDC) Sea Ice Index.

Fetterer, F., K. Knowles, W. Meier, and M. Savoie. 2002, updated daily. Sea Ice Index. Daily Sea Ice Extent Climatology. Boulder, Colorado USA: National Snow and Ice Data Center. http://dx.doi.org/10.7265/N5QJ7F7W.

The actual file I used is downloadable from this FTP location.


3 Comments

In the previous post I made a plot of Antarctica and compared it to the size of Europe. I made the throwaway point that it was unreasonable to imagine Antarctica as being characterized with one climatic zone. It is not all the "coldest and windiest place" on Earth.

I thought a simple example would show what I mean:

I got the mean monthly temperatures at two Antarctic Stations from the NOAA NCDC GCPS MONTHLY STATION data available from IRI/LDEO Climate Data Library.

I chose Adelaide Island and Vostok, and picked monthly data from December 1964 to December 1966.

Adelaide Island and Vostok mean monthy temperature
The mean monthly temperature at Adelaide Island and Vostok station

Adelaide island is on the coast and it astonishingly beautiful. The data I used were collected at the British Antarctic Survey BASE T.

In contrast Vostok station is quite literally an icy waste in the middle of nowhere (* but see below).

This plot shows their relative locations in relation to the South Pole.

The locations of research stations
The locations of Adelaide Island, Vostok, and South Pole

You can see that at Adelaide Island - which is at sea level and coastal - the seasonal cycle is relatively narrow and only about 11°C. Temperatures are above 0°C in the summer.

At Vostok - which is on the East Antarctic Ice Sheet and at an altitude of about 3700m - the seasonal cycle is vast. In the Antarctic summer the temperatures are about -30°C, whereas in winter the temperatures fall and it is scarily cold (monthly mean -71.4°C in August 1966!).

If you want to know why Adelaide Island has a relatively small seasonal cycle, whereas Vostok seems to have a squashed "U" shape temperature cycle, then you have to understand something about the basic meteorology of the Antarctic Regions. (As an aside then you would understand why this happens in winter).

In a later post I may say something about how the climate is changing across Antarctica over the last 50-60 years. The spoiler on that is at on the Antarctic Peninsula it has changed a lot  - in the range "4-5°C",and the changes are impacting the ocean system, whereas at Vostok it has not.

* - of course Vostok isn't really in the middle of "nowhere". It is over the vast and hugely significant under ice Lake Vostok, and is the location of the first great Antarctic ice core - the Vostok Ice Core.


8 Comments

I keep seeing a map of Antarctica with an overlaid outline of the United States. I thought it would be helpful to have a picture of the continent compared with the size of Europe.

Antarctica and Europe
Antarctica compared with the size of Europe

This is a picture from a book I wrote half of and edited a long time ago.

It always struck me as strange that Antarctica being the "coldest and windiest place" is constantly recycled. The picture shows it is a huge place and it does not have one single climate.

On the Antarctic Peninsula it is relatively mild. It's even referred to sometimes as being the "banana belt". But away from the heat of the ocean, and high on the plateau it is without doubt cold almost beyond comprehension.

But one thing is for sure: there is no representative Antarctic climate.


In March 2013 I was delighted to be asked to give a talk at TEDx Southampton.

This is what I talked about: What the poles are telling us about our world

It was brilliant to be asked to speak, and really enjoyed the fantastically well organized day. Many thanks to the hardworking large team who put it together, and in particularly James Dyke,Alison Simmance and Jonathan Akass.

On the TEDx Southampton YouTube channel for the event are some amazing talks from that day.


6 Comments

As a marine scientist I have always had an obsession with the sea and what it is doing. You can see that by looking at the photos section of this site, or my flickr stream.  A couple of weeks ago Dr Ian Brooks (Leeds) tweeted to a colleague, a movie clip of a ship in bad storm.  I looked at the video and there was no doubt. It was taken on the RRS James Clark Ross when I was on board. Here is the clip:

It was taken by Doug, who was then the Third Officer of the James Clark Ross, and I think that I was probably standing on the bridge with him and my two colleagues Dr Geli Renner, and Dr Paul Holland. We were the night shift on a research cruise in the Bellingshausen Sea.

...continue reading

12 Comments

This morning I posted my 10,000 tweet.

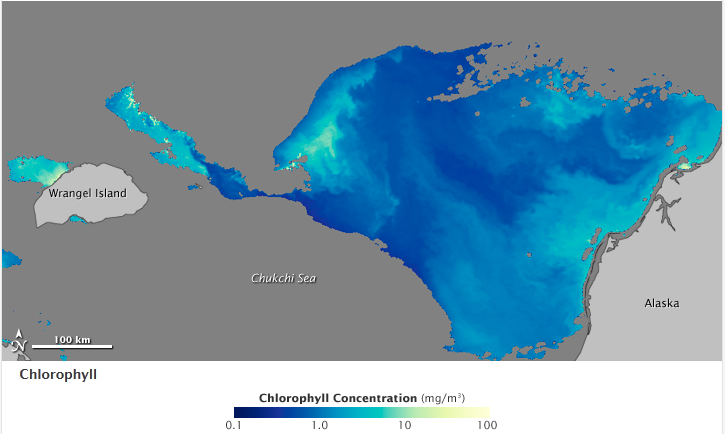
Whilst I am not sure if 10,000 is significant, I pointed to the brilliant NASA Earth Observation www site which has a wonderful post today about the reduction of sea ice increasing phytoplankton growth in the Arctic. (Be sure to click the "image comparision" button on that page).

High chlorophyll in open water
Sat picture from 10 July 2011 showing milligrams of chlorophyll per cubic meter of seawater. From the Aqua Satellite

...continue reading

I got an email from a friend asking me about the picture I am using for the blog header.

"Where did you take that?"

Antarctica on 30th March 2007 in southern Marguerite Bay, and looking towards the Antarctic Peninsula.

It was a fantastic day's work, making oceanographic measurements with CTD sensor to work out the ocean circulation beneath the King George VI Ice shelf.

Here is an picture with a similar view from the same day showing the whole scene.

King George VI Sound
King George VI Sound facing the Antarctic Peninsula

...continue reading